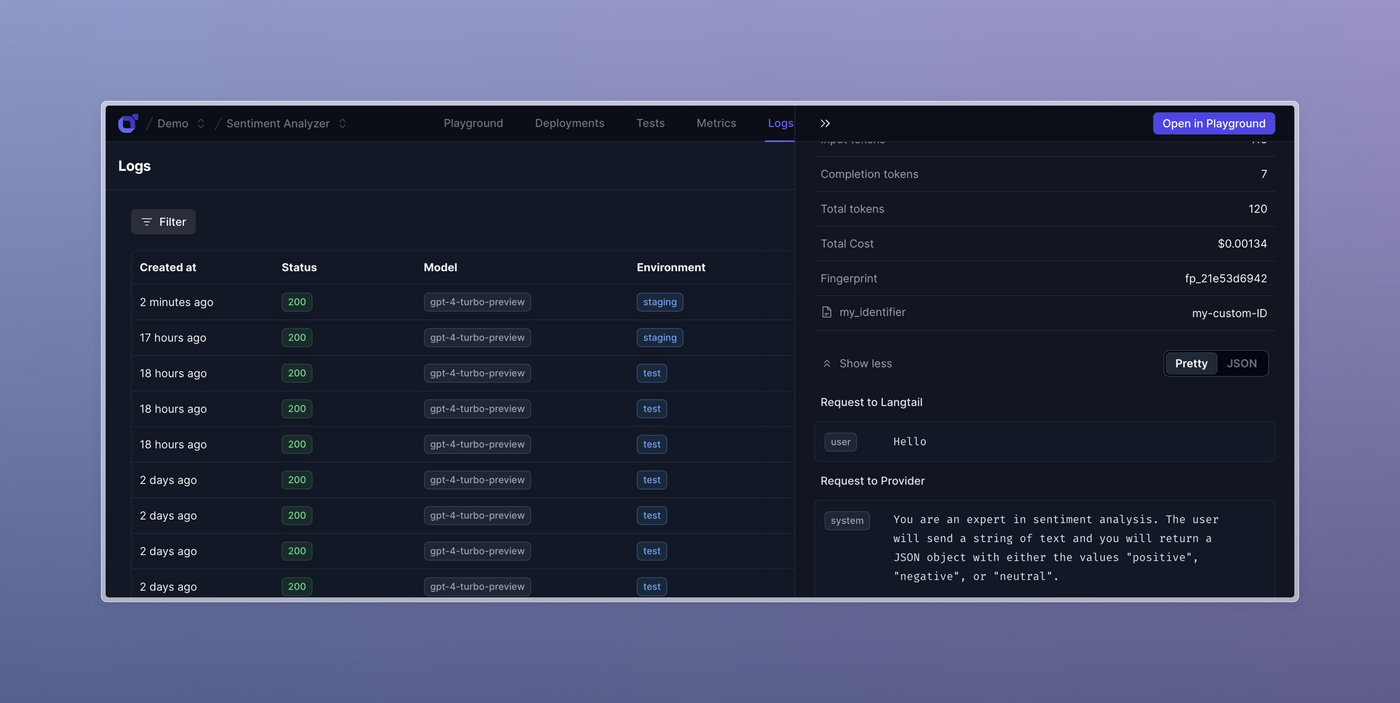
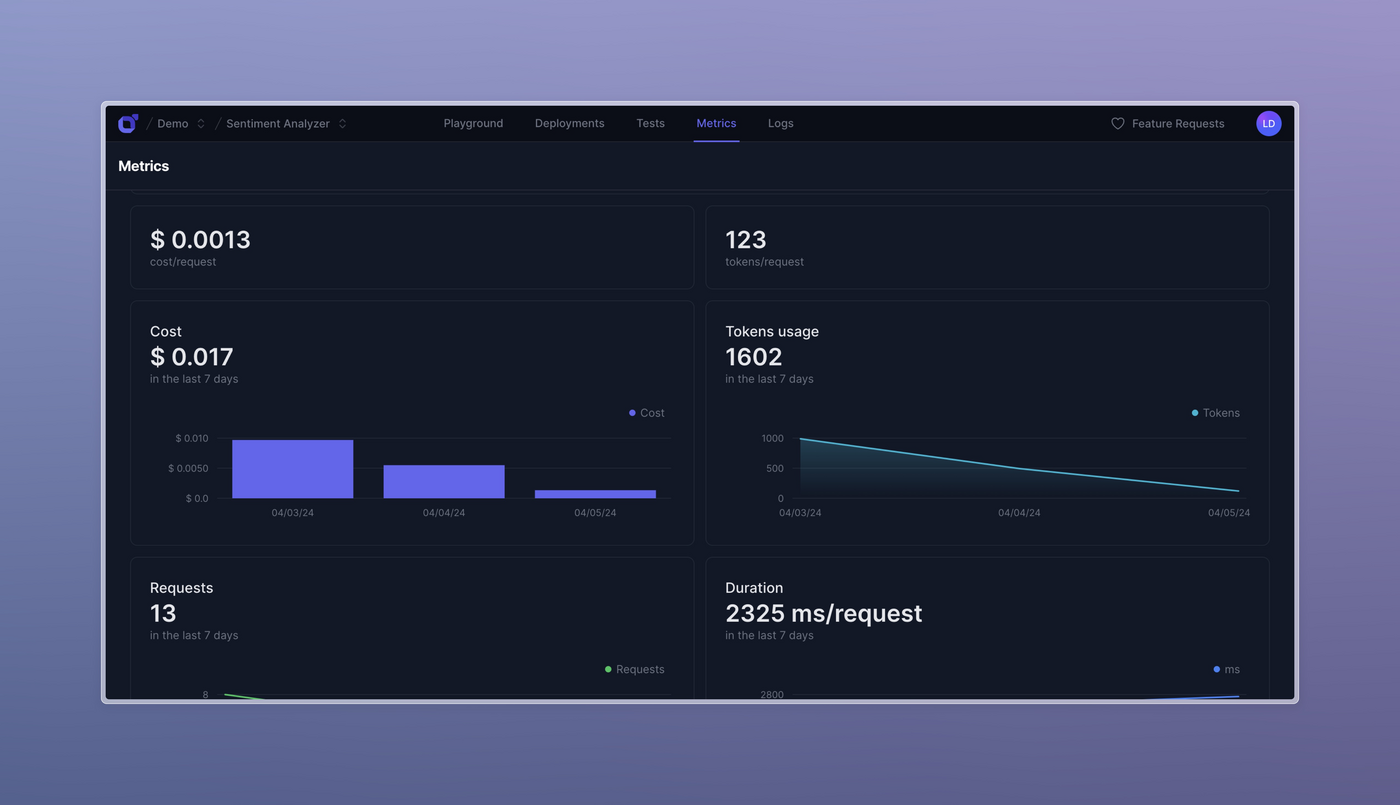
Langtail’s observability features allow you to get an overview of what’s happening to your application both during development and in production. You can look at logs to find out where you app isn’t returning the best result and at metrics to see how latency and cost are affecting your app. Here’s a quick overview of both:Documentation Index
Fetch the complete documentation index at: https://langtail.com/docs/llms.txt
Use this file to discover all available pages before exploring further.
Logs

- When you open a prompt, click the Logs tab in the navigation bar. Here you will see all logs from this prompt.
- From the project view, click the Logs tab on the left sidebar. Here you will see logs from every prompt in the project.
Metrics

- When you open a prompt, click the Metrics tab in the navigation bar. Here you will see only the metrics from this prompt.
- From the project view, click the Metrics tab on the left sidebar. Here you will see aggregated metrics from every prompt in the project.

